Every UAE e-commerce merchant hears the same pitch: "Same service, better price." Every merchant who switches on that pitch spends the next quarter figuring out why the P&L didn't move — or why it got worse.
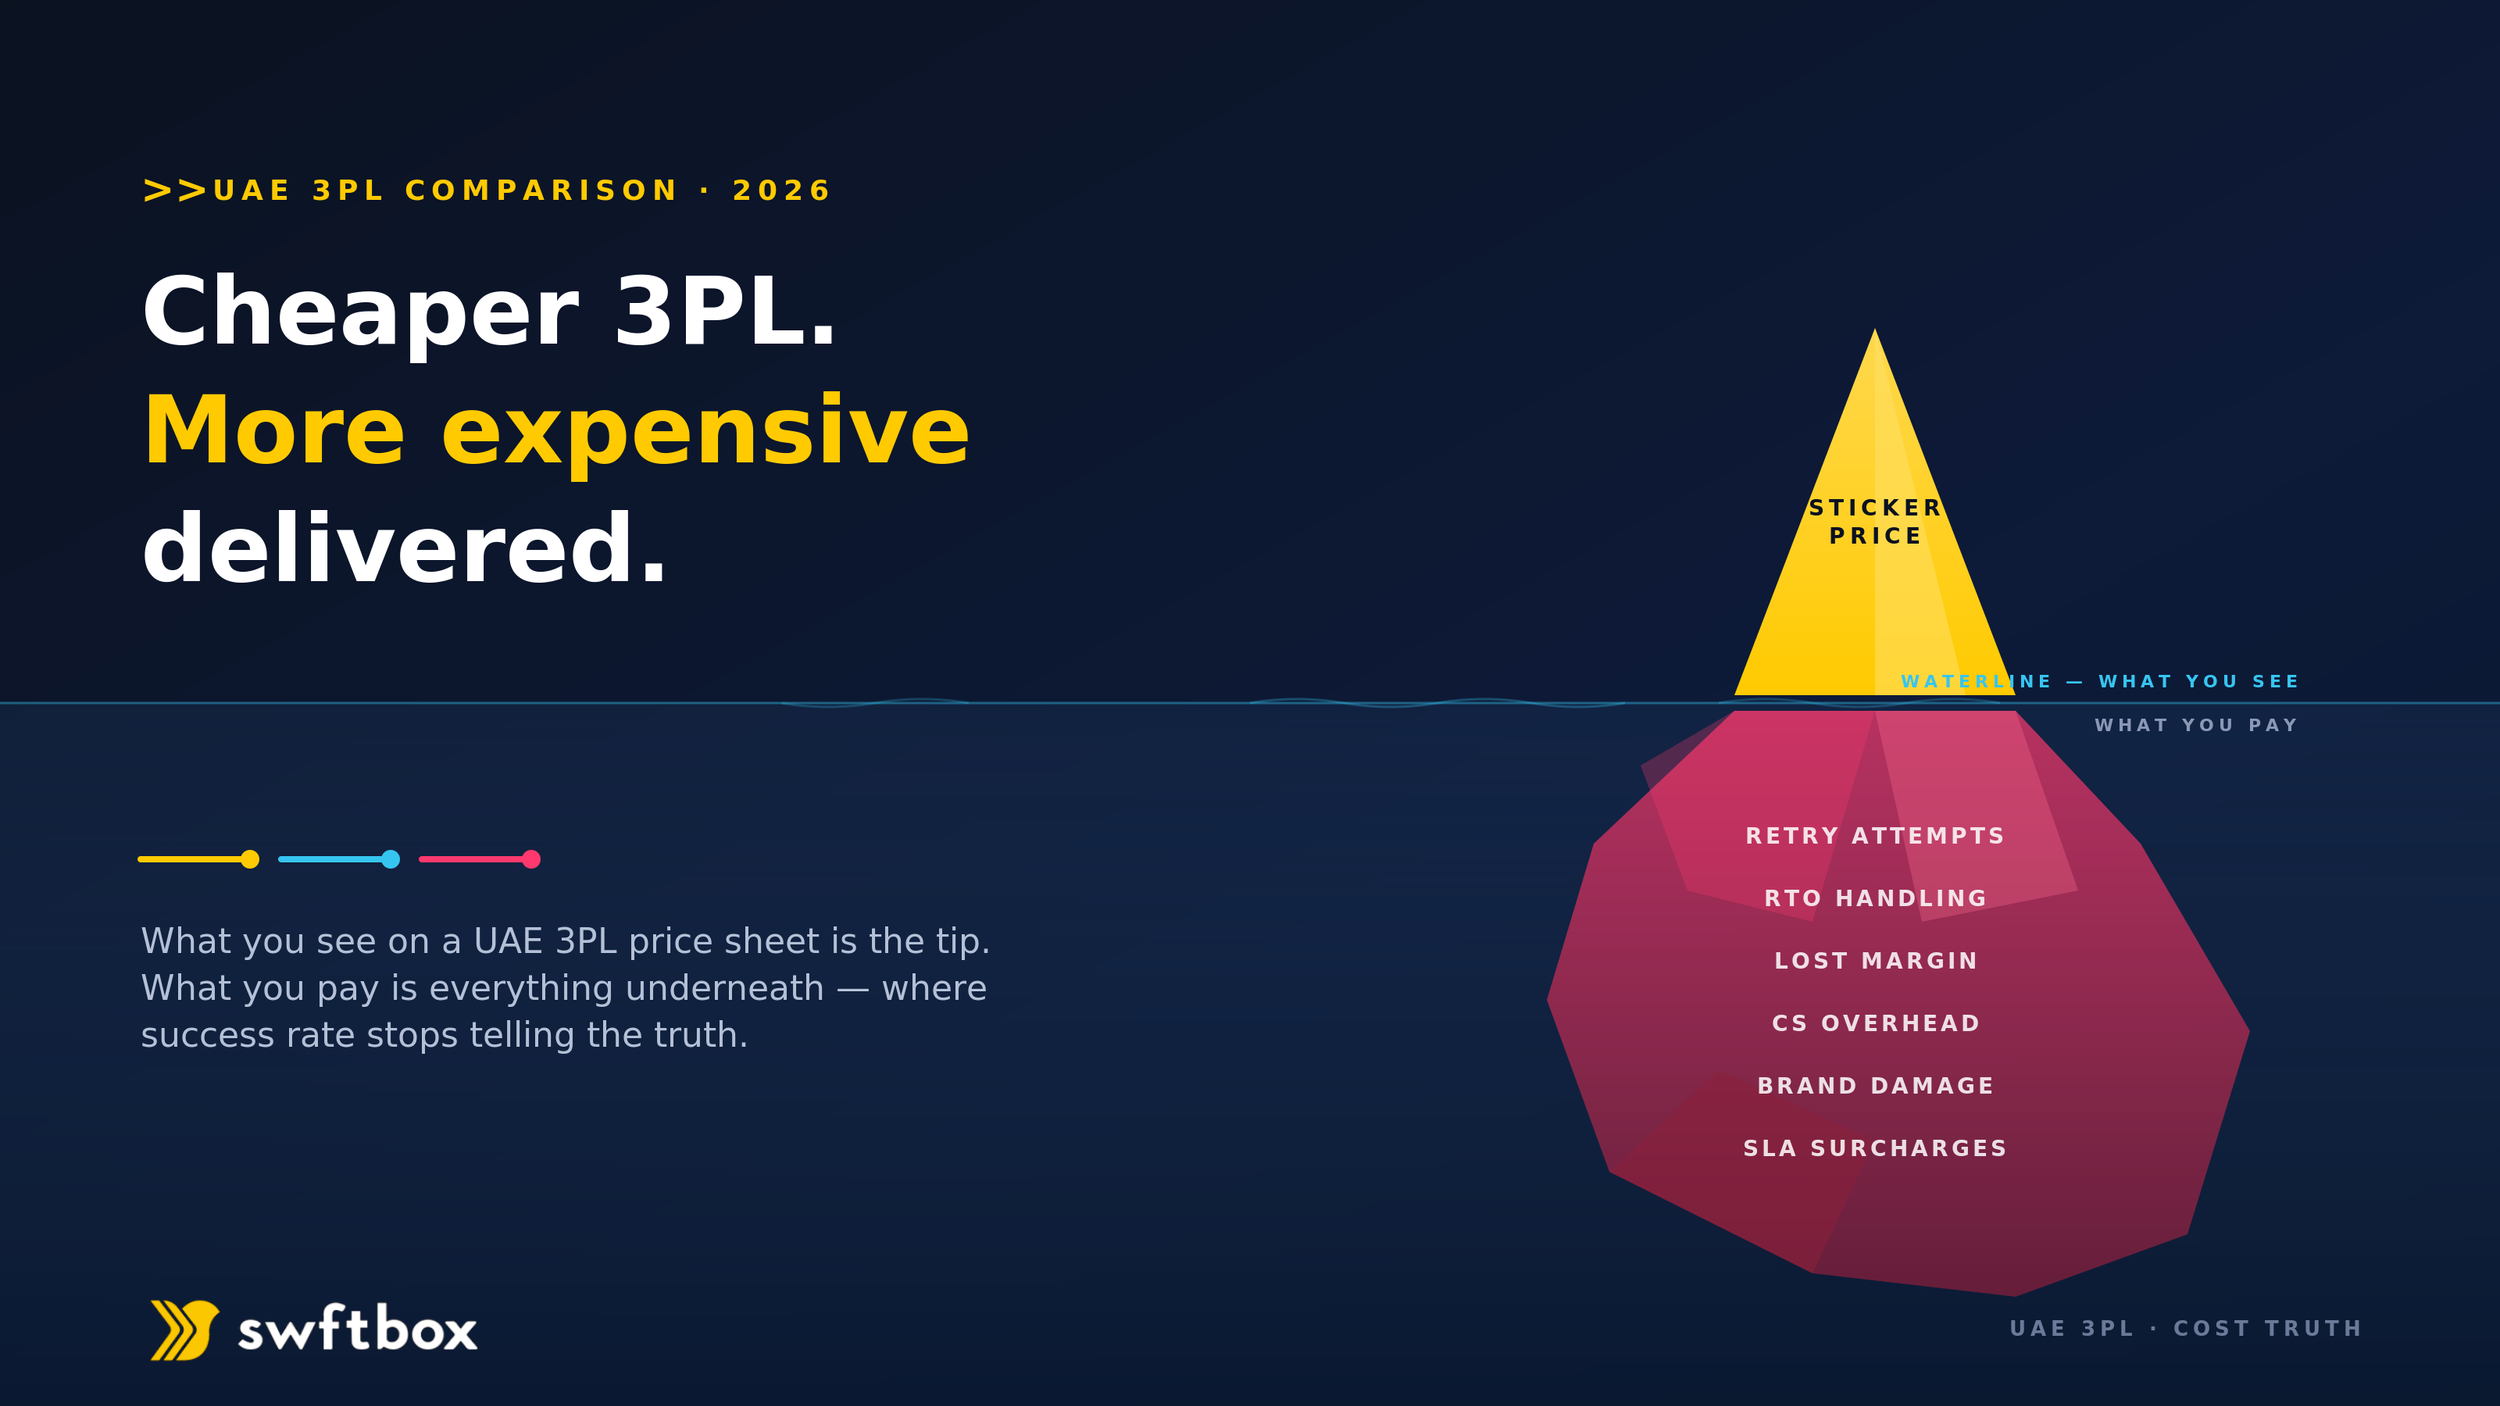
The pitch is a trap. Two 3PLs with identical per-parcel sticker rates can produce a 15–25% difference in true delivered cost, and the metric merchants use to compare them — "delivery success rate" — is the least useful KPI in the industry.
This piece is for merchants evaluating a switch, and for anyone being told a cheaper 3PL delivers the same result. Companion to our last-mile delivery cost breakdown and carrier checklist.
Why does "same service, lower price" almost always cost more?
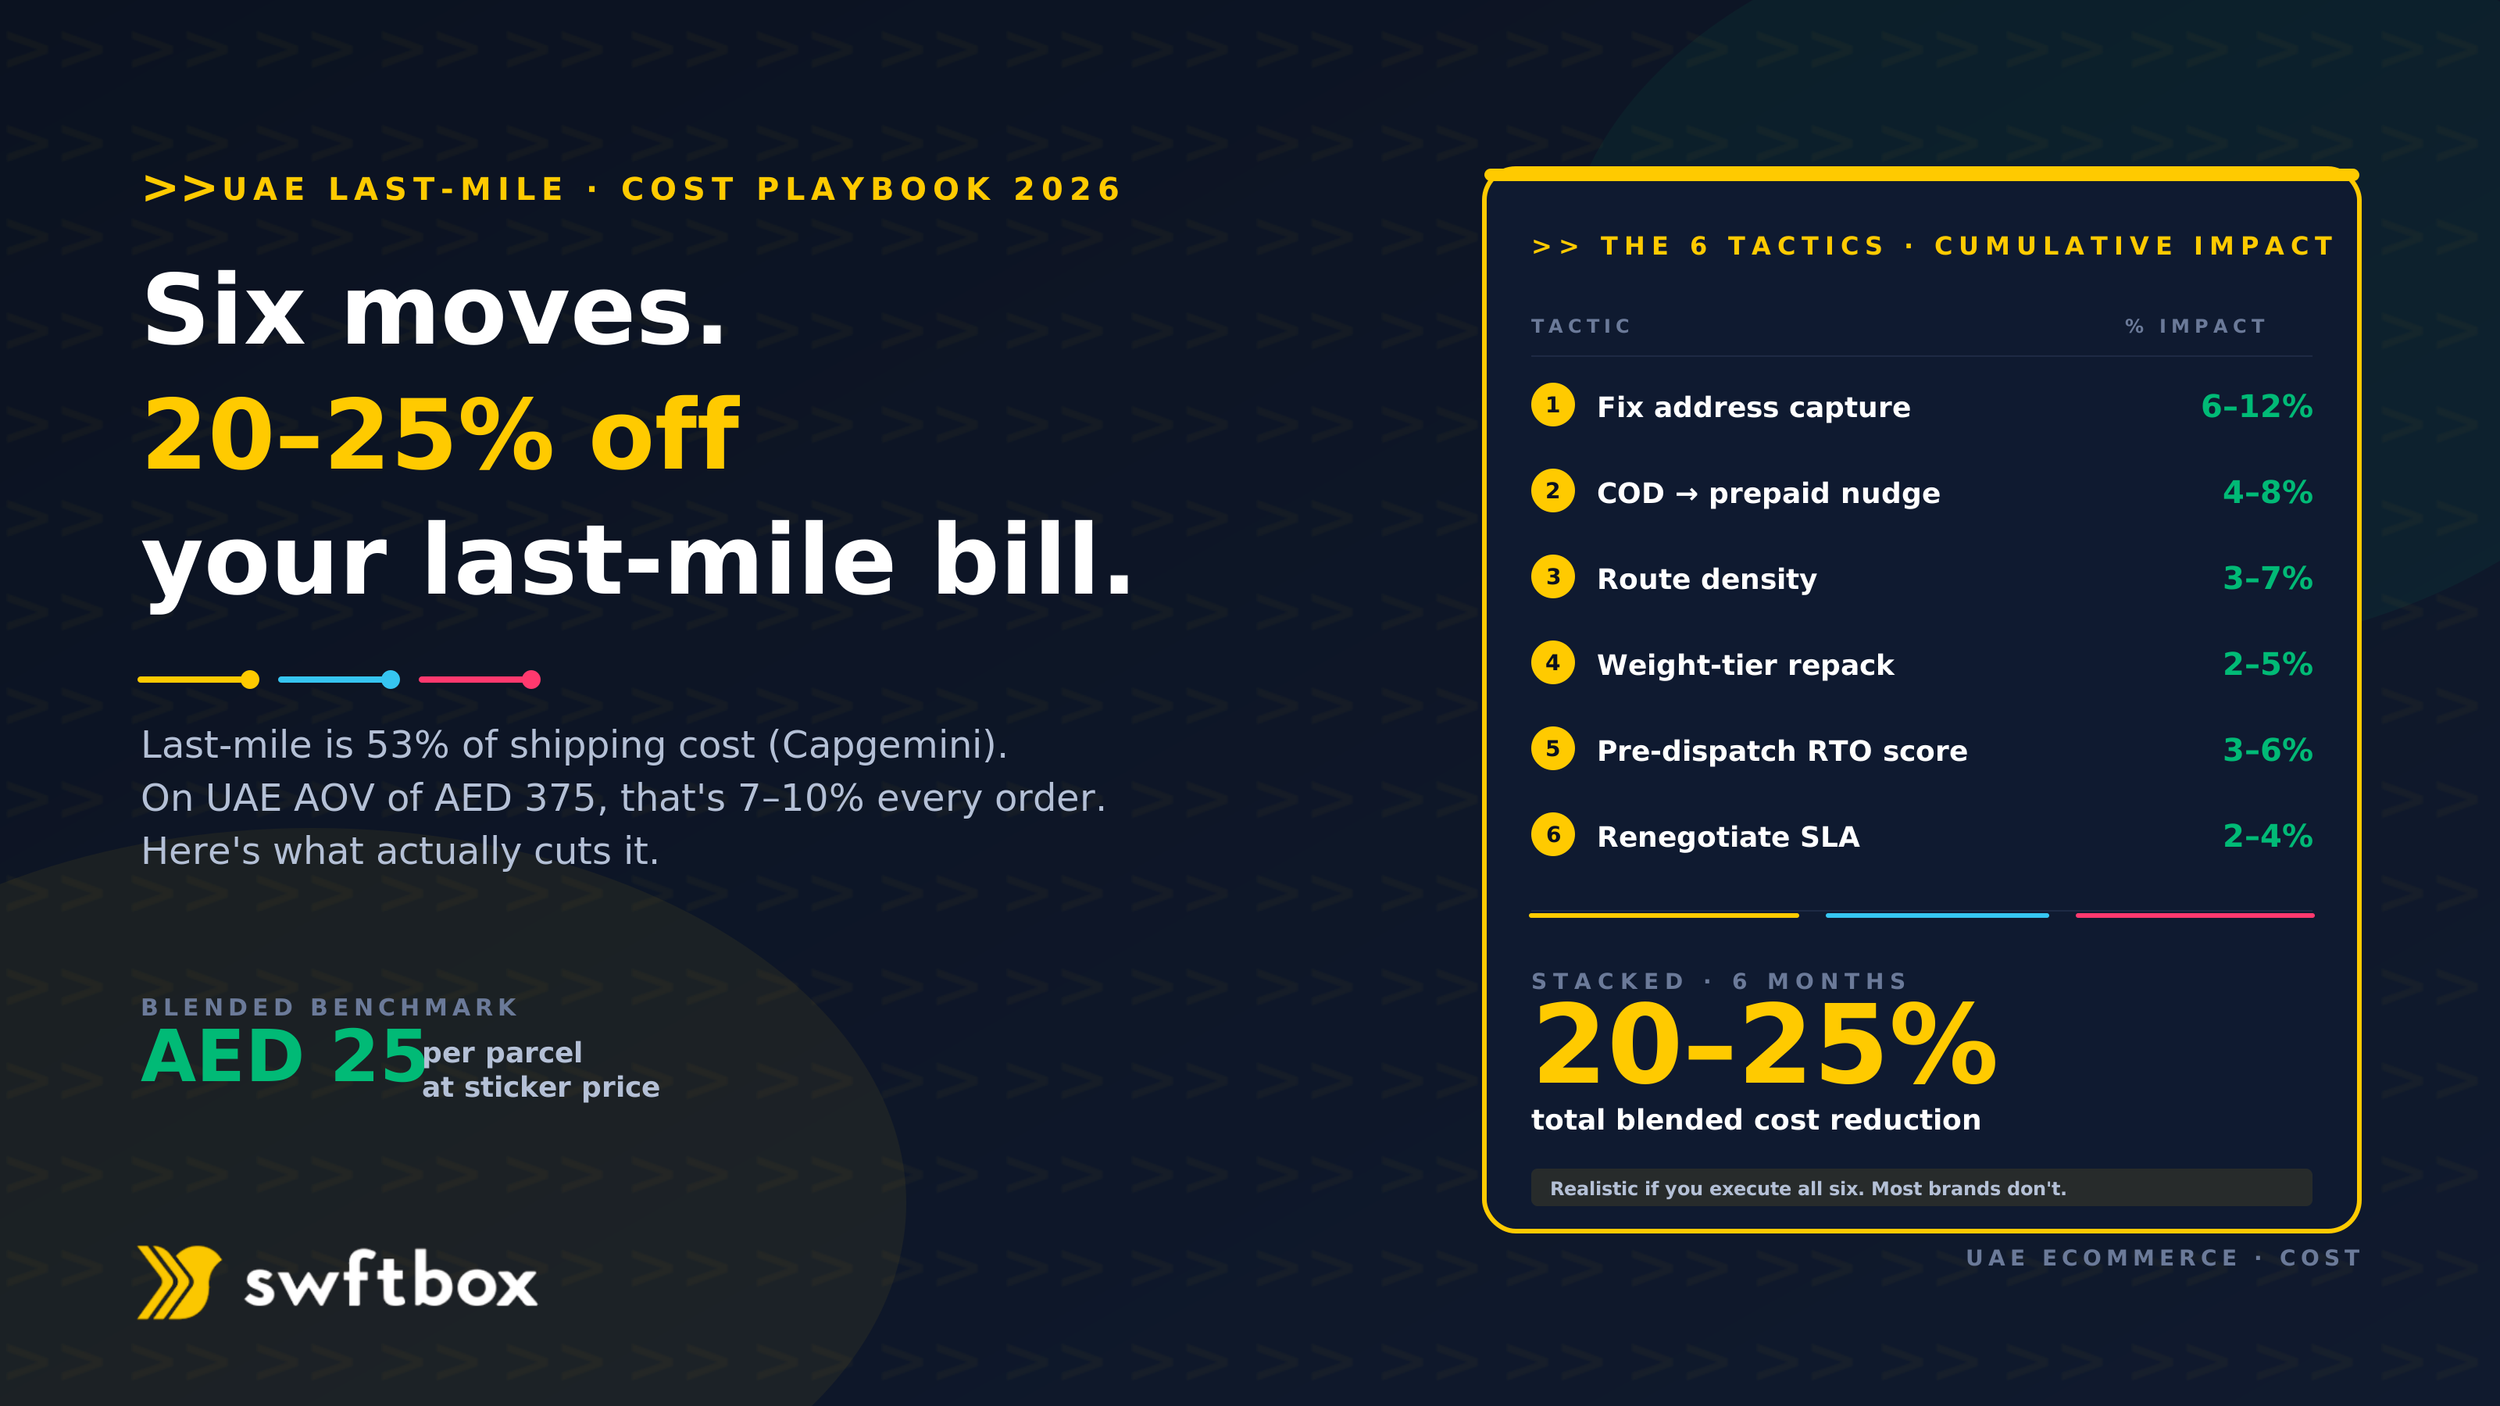
Because per-parcel sticker price is only part of your true cost per delivered order. According to the Capgemini Research Institute, last-mile alone represents 53% of total shipping cost and 41% of overall supply-chain cost globally. Inside that number, the failure modes — retries, RTOs, refunds, CS overhead, lost margin — compound fastest. Cheaper sticker + higher failure rate = higher delivered cost every time.
Failed-delivery cost is what most merchants underestimate. OneRail and HubBox research puts the true hidden cost of a failed delivery at USD 15–40 per failed order once reship, support, and lost lifetime value are included. In an AED context, that's roughly AED 55–150 per failed parcel — before you even count the RTO cost and lost margin on the product itself.
That's the hidden layer a "10% cheaper sticker rate" doesn't touch.
Why is delivery success rate a broken metric for comparing UAE 3PLs?
Because every UAE 3PL will quote you a success rate above 90%, and the metric collapses meaningful differentiation at that level.
The gap that actually matters is first-attempt success rate — did the parcel reach the customer the first time the driver visited? Well-run UAE operations hit 92–95% first-attempt success. Brands with weak address quality sit around 85% (swftbox merchant data). That 7–10 percentage-point gap is invisible on a "delivery success rate" spec sheet.
Let's run the math on 1,000 monthly orders at AED 375 UAE AOV with realistic UAE inputs:
Retry cost — 15–25% of original delivery cost per attempt (HubBox, OneRail). At AED 25 blended delivery cost = AED 5 per retry.
RTO conversion — assumed 30% of failed first-attempts end in RTO (a mixed-payment operator profile, in line with industry RTO ranges of 25–35% for COD-heavy stores).
RTO handling cost — assumed AED 45 per RTO parcel (return leg + handling).
CS overhead — retail e-commerce cost per contact is USD 2.70 with an average 2.3 contacts per issue (Ringly / Gartner benchmark) = AED 23 CS overhead per failed order (USD 6.21 × AED 3.67).
Lost margin on RTO'd orders — 30% typical product margin × AED 375 AOV = AED 112 per lost order.
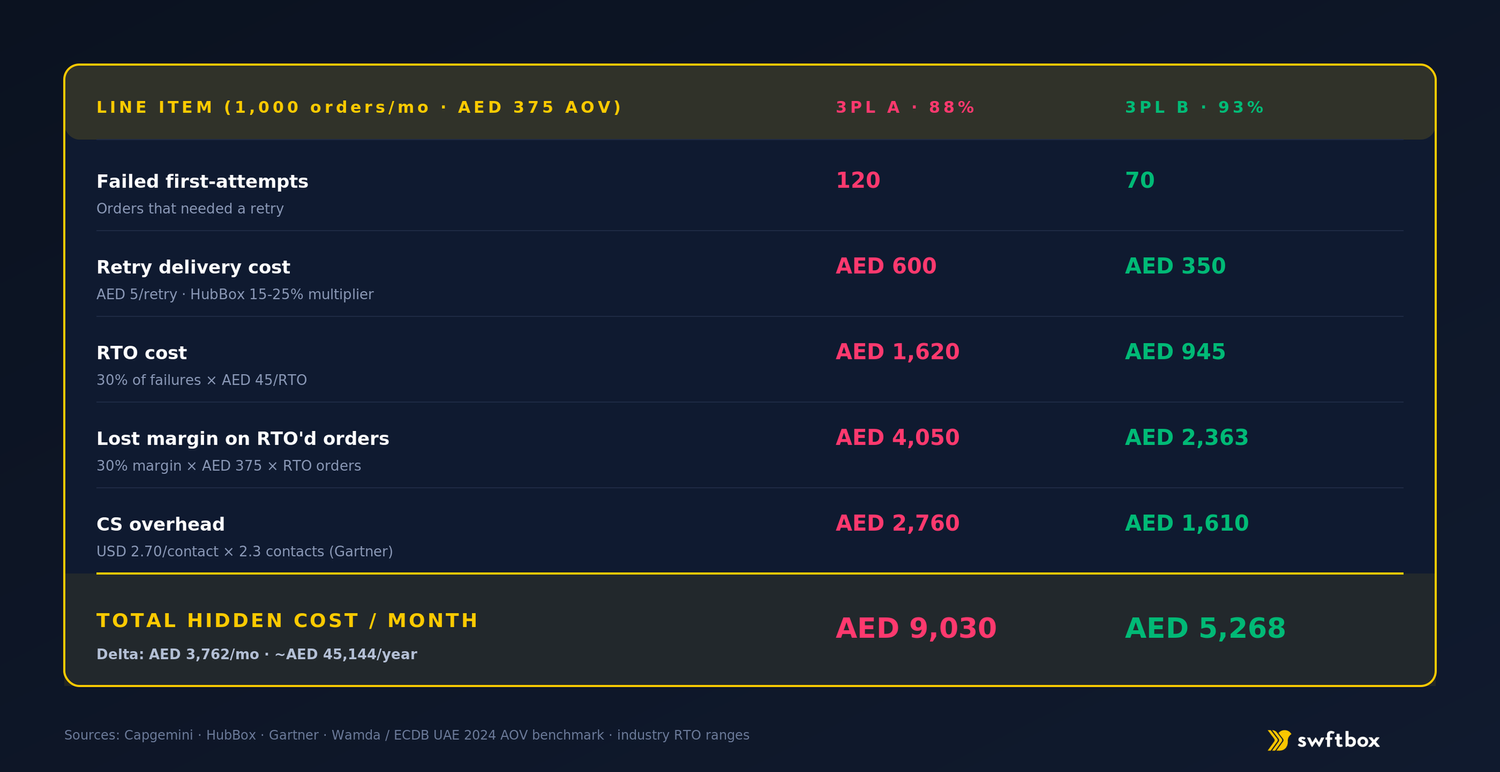
The delta between an 88%-first-attempt 3PL and a 93%-first-attempt 3PL on 1,000 monthly orders is roughly AED 3,760 per month in hidden cost — over AED 45,000 per year. Even if the "cheaper" 3PL saves you AED 3 per parcel on sticker (AED 3,000/month), you're still worse off delivered.
Modeling assumptions
Four inputs in the table above are estimates rather than direct citations: (1) the 30% RTO conversion rate on failed first-attempts, (2) the AED 45 RTO handling cost per parcel, (3) the 30% typical product margin, and (4) the AED 25 blended sticker delivery cost. Each is defensible for a well-run UAE e-commerce merchant on a mixed-payment mix, but change with category (fashion is higher, food is lower). Adjust to your own numbers before quoting the total to a stakeholder — the shape of the argument holds either way.
And this only measures four hidden cost lines. It doesn't count the brand damage from a late delivery to a repeat customer, or the 24.5% global e-commerce return rate that compounds on top of RTO.
What should UAE merchants compare instead of success rate?
Six metrics, in priority order. If a 3PL can't share numbers on these, they don't have the data to serve you — regardless of what their price sheet says.
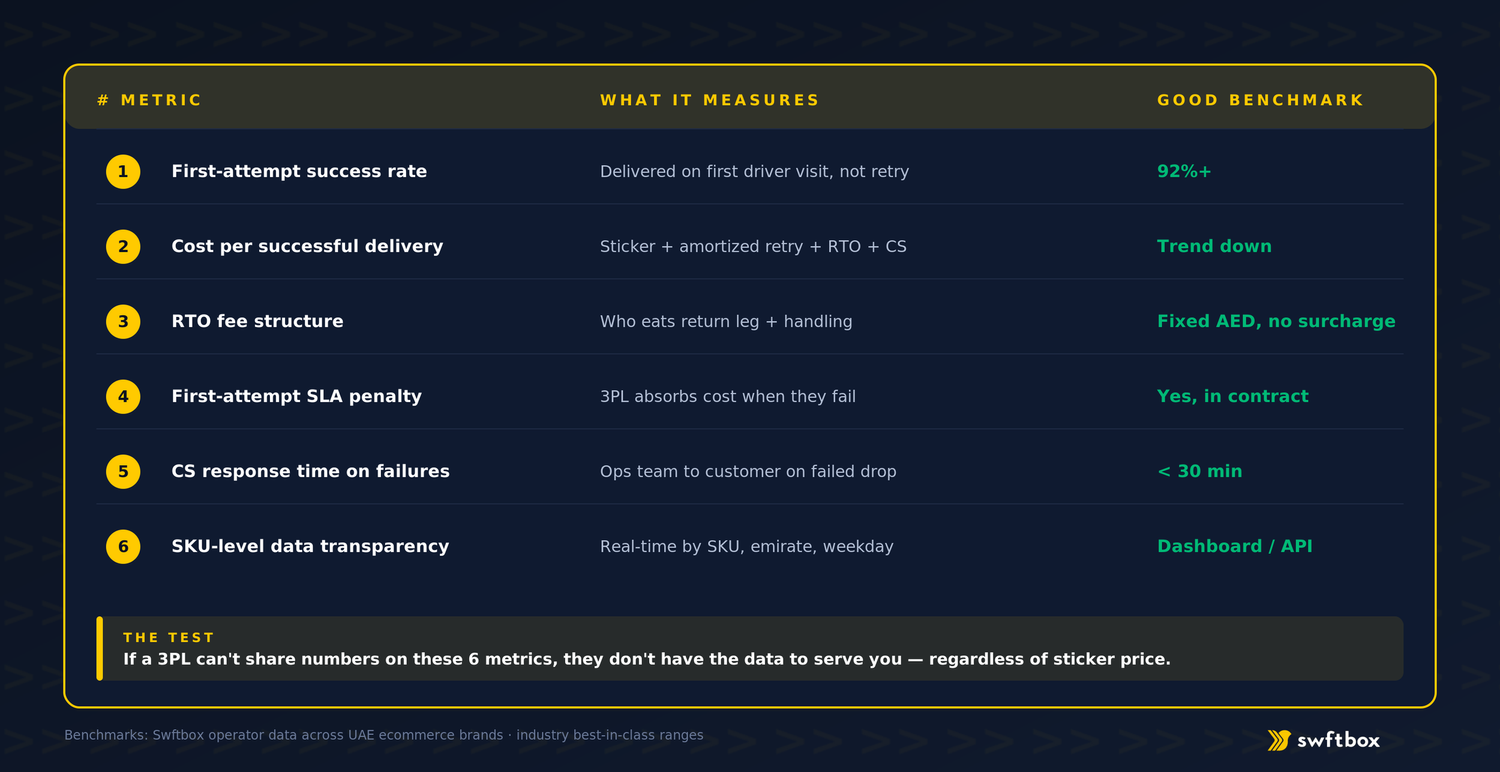
The metrics correlate. A 3PL that scores well on first-attempt success usually also scores well on data transparency — because you can't optimize what you can't measure. Cheap 3PLs typically score poorly on both.
What questions should you ask a cheaper 3PL before switching?
Eight questions. If they can't answer any two of them precisely, walk away — regardless of the sticker rate.
What's your first-attempt success rate for merchants in my category and my emirate mix?
What's your RTO fee schedule, in AED, per weight tier?
Do you charge for re-attempts, or absorb them?
What's the minimum-volume commitment, and what triggers claw-backs?
Where are the weight-tier boundaries in your rate card?
Are there fuel surcharges or peak-season adjustments during Ramadan, White Friday, or BTS?
What real-time data can I see — dashboard, API, or monthly summary?
What's the exit clause — how quickly can I leave, and what data do I keep?
Cheap 3PLs typically fail on questions 2, 3, 5, 6, and 8 — because that's where the margin they're not showing on the sticker rate lives.
When is the cheaper 3PL genuinely the right call?
Sometimes it is. Three scenarios where the sticker-rate saving actually holds up:
Low-AOV, high-margin, single-emirate operations where the absolute AED cost of a failed delivery is small.
Merchants with strong in-house customer-service teams who can absorb the CS overhead of a weaker-performance 3PL.
Pilot / test volumes under 500 orders/month on price-sensitive SKUs where a failed delivery is low-consequence.
Outside these three profiles, cheaper is nearly always more expensive delivered. The math compounds quietly, and shows up in the P&L 60–90 days after the switch.
What's the honest 3PL comparison framework?
Three columns on a spreadsheet.
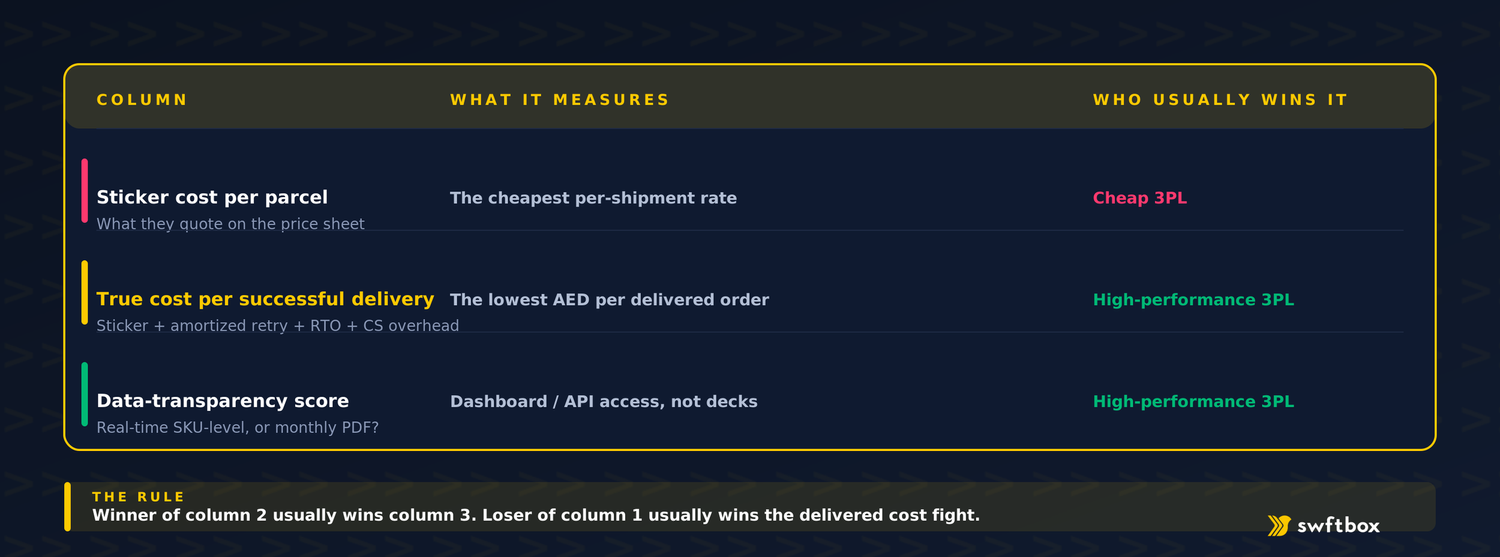
The 3PL with the lowest sticker cost usually loses on column 2. The 3PL that wins on column 2 usually wins on column 3 — because you can't optimize cost-per-successful-delivery without visibility into the underlying data.
That's the answer to the "cheaper delivery" pitch. Not "we're worth more." Not "look at our success rate." Show the three-column spreadsheet and let the math argue.
The bottom line for merchants
If your current 3PL conversation is stuck on sticker price, you're comparing the wrong number.
The right question isn't "who's cheaper per shipment?" It's "who delivers the highest number of successful, on-time, undamaged parcels at the lowest total delivered cost — and can prove it with data?"
That question has a different answer, and the answer is rarely the cheapest sticker rate.
Want to run the three-column comparison on your current 3PL?Get a 20-minute cost audit from swftbox — we'll calculate your true cost per successful delivery against the sticker rate you're paying now. No pitch, just the math.
Ship with swftbox
Same day delivery, fulfillment and returns across the UAE.